Trace
Tips on tracing large, complex spreadsheets
Below are several methods to reduce diagram clutter or speed up the tracing process:
- Exclude outputting the cell contents (i.e., omit the cell values or formulas). Only cell addresses will appear on the dependency diagrams.
- Trace in parts. Instead of tracing the whole worksheet, trace only selected cells or cell ranges. At times, we are only interested in some parts or regions (not the whole) of the worksheet. For example, if we are only interested to map the cell precedents and cell dependents for one formula in cell B1, trace just cell B1.
- Trace hubs only. Select the cells which form the "hub" of calculations. Hubs refer to cells which depend or require values from many other cells. A hub can be identified usually by tracing the whole worksheet first. In the diagram, you can identify hubs by examining the convergence of a lot of arrows to one or two cells only. These cells are hubs.
- Use tred.exe program which comes with Graphviz. After tracing the worksheet, run, using the command line, tred.exe on your dot file as follows:
tred dot1.txt >dot2.txt
which produces another dot file called dot2.txt. Then run dot.exe to produce the GIF diagram as follows:
dot dot2.txt -Tgif -odot2.gif
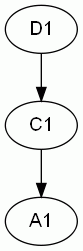
where dot2.gif is the GIF file. Note, however, that tred.exe removes extraneous arrows which may, at times, be less helpful because it removes some one-to-one cell relationships (see figures below).
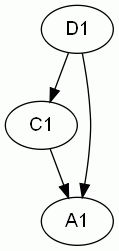
 Before tred.exeAfter tred.exe
Experiment this feature to see if the resultant diagram improves clarity and interpretation. Refer to Graphviz documentation on tred.exe.
- Breakup your spreadsheet into several smaller and distinct worksheets, so that each worksheet performs a separate and unique task. Keep each worksheet as independent from each other as possible. In other words, reduce as much as possible the linkages between worksheets. Keep each worksheet as small as possible. Completing that, you can then trace the worksheet of interest. Of course, if you are auditing a spreadsheet, this option is not viable.
- Use Graphviz viewers such as ZGRViewer that provide tools to help to view very large diagrams.